
Bitcoin Faces $55K Stress Test as 10x Research Cites Several Bearish Signals
Key Takeaways
- 10x Research targets $55,000 as bitcoin’s cycle low, with the timing window set for late August to October 2026.
- Spot bitcoin exchange-traded fund (ETF) outflows running into the billions, not corporate selling, are the primary driver of current downside pressure per 10x Research.
- Polymarket traders are pricing a 64% probability bitcoin reaches $55,000 or lower before 2027, with Kalshi showing similar 65% odds by year-end.
Where Bitcoin Stands Now
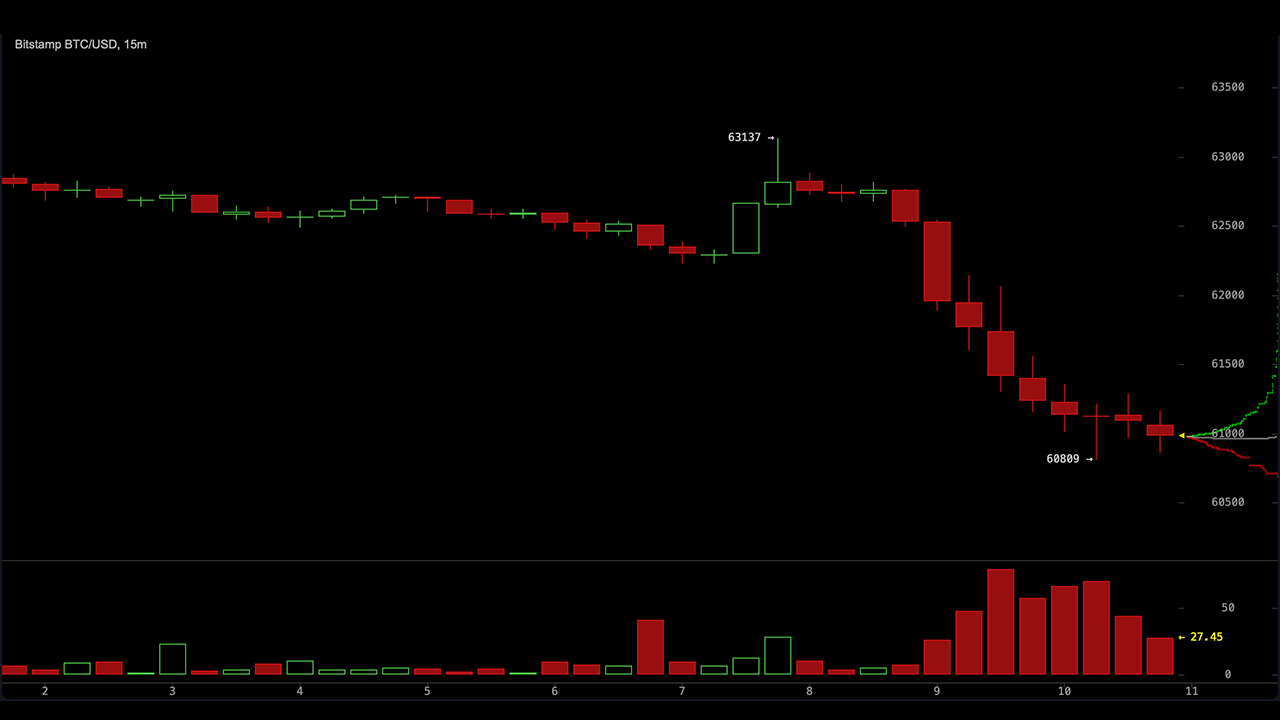
Bitcoin traded below $61,000 on June 24, roughly 51% below its October 2025 all-time high above $126,000.
The asset has been testing or breaking below the $65,000 to $60,000 support band amid ETF outflows, thinner futures open interest, and persistent macro pressure from above-forecast inflation data.
The $55,000 Target
In a report published June 23, titled “ Bitcoin: The Time and Price That Will Likely Mark the ‘Cycle’ Low,” 10x Research identified $55,000 as the actionable low zone for this cycle. Thielen framed the call as a roadmap built from converging signals across USD strength, global liquidity models, onchain cost-basis data, and historical cycle patterns.
The firm says this is a stress-test floor representing genuine value, not a prediction of total collapse.
Why ETF Flows Are Driving the Move
10x Research places exchange-traded fund (ETF) institutional selling, not corporate treasury activity, as the primary driver behind bitcoin’s current slide. Cumulative spot bitcoin ETF outflows have run into the billions since hot consumer price index (CPI) prints earlier this year, with some short-period waves exceeding $1 billion. Stablecoin outflows have added further pressure.
The firm also notes that oversold readings on indicators like the relative strength index are insufficient to signal a reversal without improving flows behind them.
The USD Trigger
One of the more specific signals in 10x Research’s model is a USD strength indicator that has fired only six times since 2011. The most recent trigger came in November 2025 and preceded the current phase of downside pressure. When that signal has appeared historically, bitcoin has typically declined in the months that followed.
What Onchain Data Shows
Bitcoin’s realized price, which reflects the average cost basis of coins currently in circulation, sits near $53,000 to $55,000. That level has historically acted as a gravitational support zone during bear phases. Cryptoquant‘s models point to a similar range as the likely ultimate floor for this cycle.
Prediction Markets Align
Traders on Polymarket are pricing roughly a 64% probability that bitcoin hits $55,000 or lower before 2027. Kalshi shows approximately 65% odds of a drop below that level by year-end.
More bearish outliers, including Galaxy Research, are targeting the $40,000 to $46,000 range in the fourth quarter. Most credible analyst targets, though, center on the $55,000 to $57,000 zone as a realistic stress test if current supports fail.
Timing Over Price
10x Research emphasizes that bear market bottoms rarely form as single capitulation events. The firm expects a multi-month base-building process in the late summer to early fall window rather than a sharp, one-day reversal.
Key Levels to Watch
- $65,000: immediate overhead resistance
- $60,000 to $62,000: current support zone under pressure
- $55,000 to $57,000: 10x Research’s higher-conviction value area