
Will SOL reclaim $80 next after USDC mint sparks breakout?
Solana price has climbed to around $78 on July 15 after a 250 million USDC mint on the network, combined with softer U.S. inflation data, injected fresh buying momentum across crypto markets.
Summary
- Solana price jumped toward $78 after a 250 million USDC mint boosted on-chain liquidity and risk appetite improved.
- Technical charts show a breakout above a descending channel, with $80 emerging as the next key resistance.
- Rising active addresses, institutional developments, and liquidation clusters support upside, while $70-$75 remains critical support.
The move gathered pace after the USDC Treasury minted 250 million USDC on Solana, adding immediate liquidity to the ecosystem as traders returned to risk assets following the latest U.S. inflation print. Capital quickly rotated into Solana-based decentralized exchanges, helping SOL recover from recent weakness while the wider crypto market also moved higher.
Earlier selling pressure had left Solana trading well below its May highs as geopolitical tensions, institutional distributions and weaker on-chain activity weighed on sentiment.
Today’s rebound, however, arrives with stronger participation. Daily trading volume has climbed above $2.1 billion, suggesting buyers, rather than short-term speculation alone, have supported the advance.
Technical structure favors another test of $80
The daily chart shows Solana (SOL) price holding above a long-standing support area between $70 and $75 after repeatedly defending that range over recent weeks. Price now trades above the 20-day and 50-day moving averages near $73.3-$74 while remaining below the declining 100-day moving average around $80.3 and well beneath the 200-day moving average near $91.
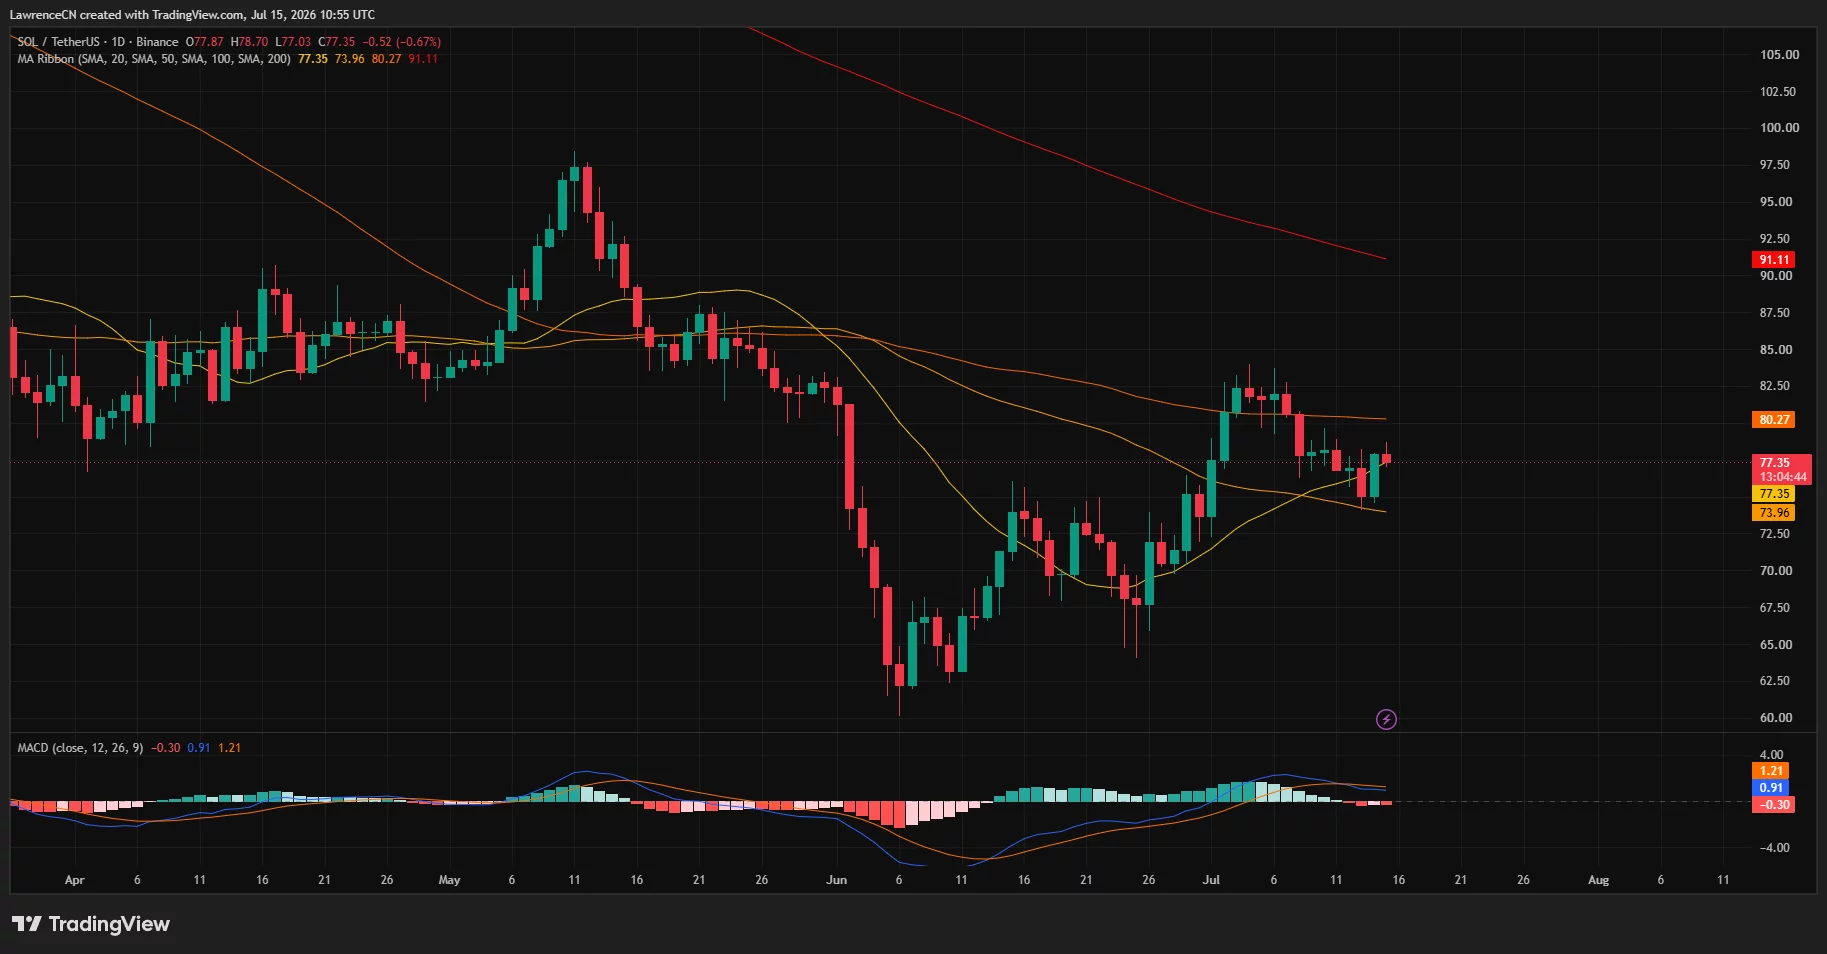
A sustained close above the 100-day average would expose the psychologically important $80 level before opening room toward the May swing high near $82.
The 4-hour chart adds another constructive development. SOL has broken above a descending channel that had contained price action since early July, while the RSI has recovered to roughly 52 after bouncing from oversold territory.
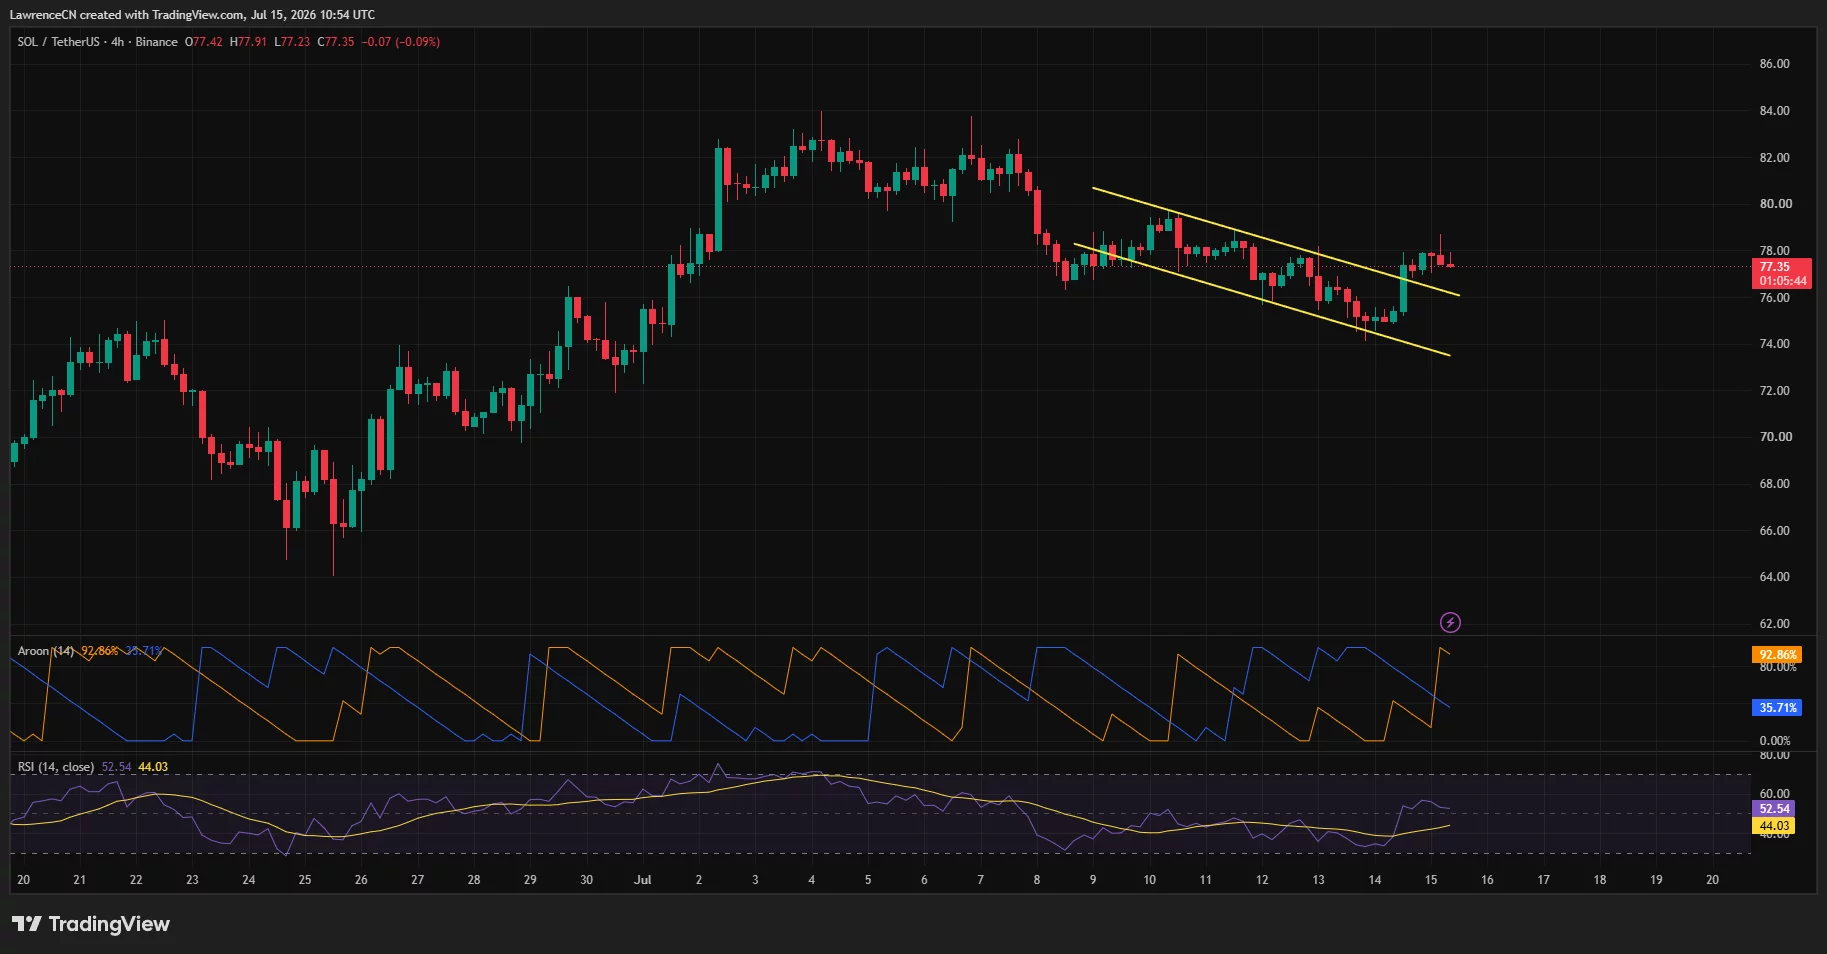
The Aroon Up reading near 93 also holds well above the Aroon Down line, suggesting buyers currently control short-term momentum, although resistance remains concentrated just below $80.
Derivatives positioning reinforces that technical picture. CoinGlass liquidation data shows dense short liquidation clusters stacked between $78.5 and $80, with another concentration extending toward $81.5.
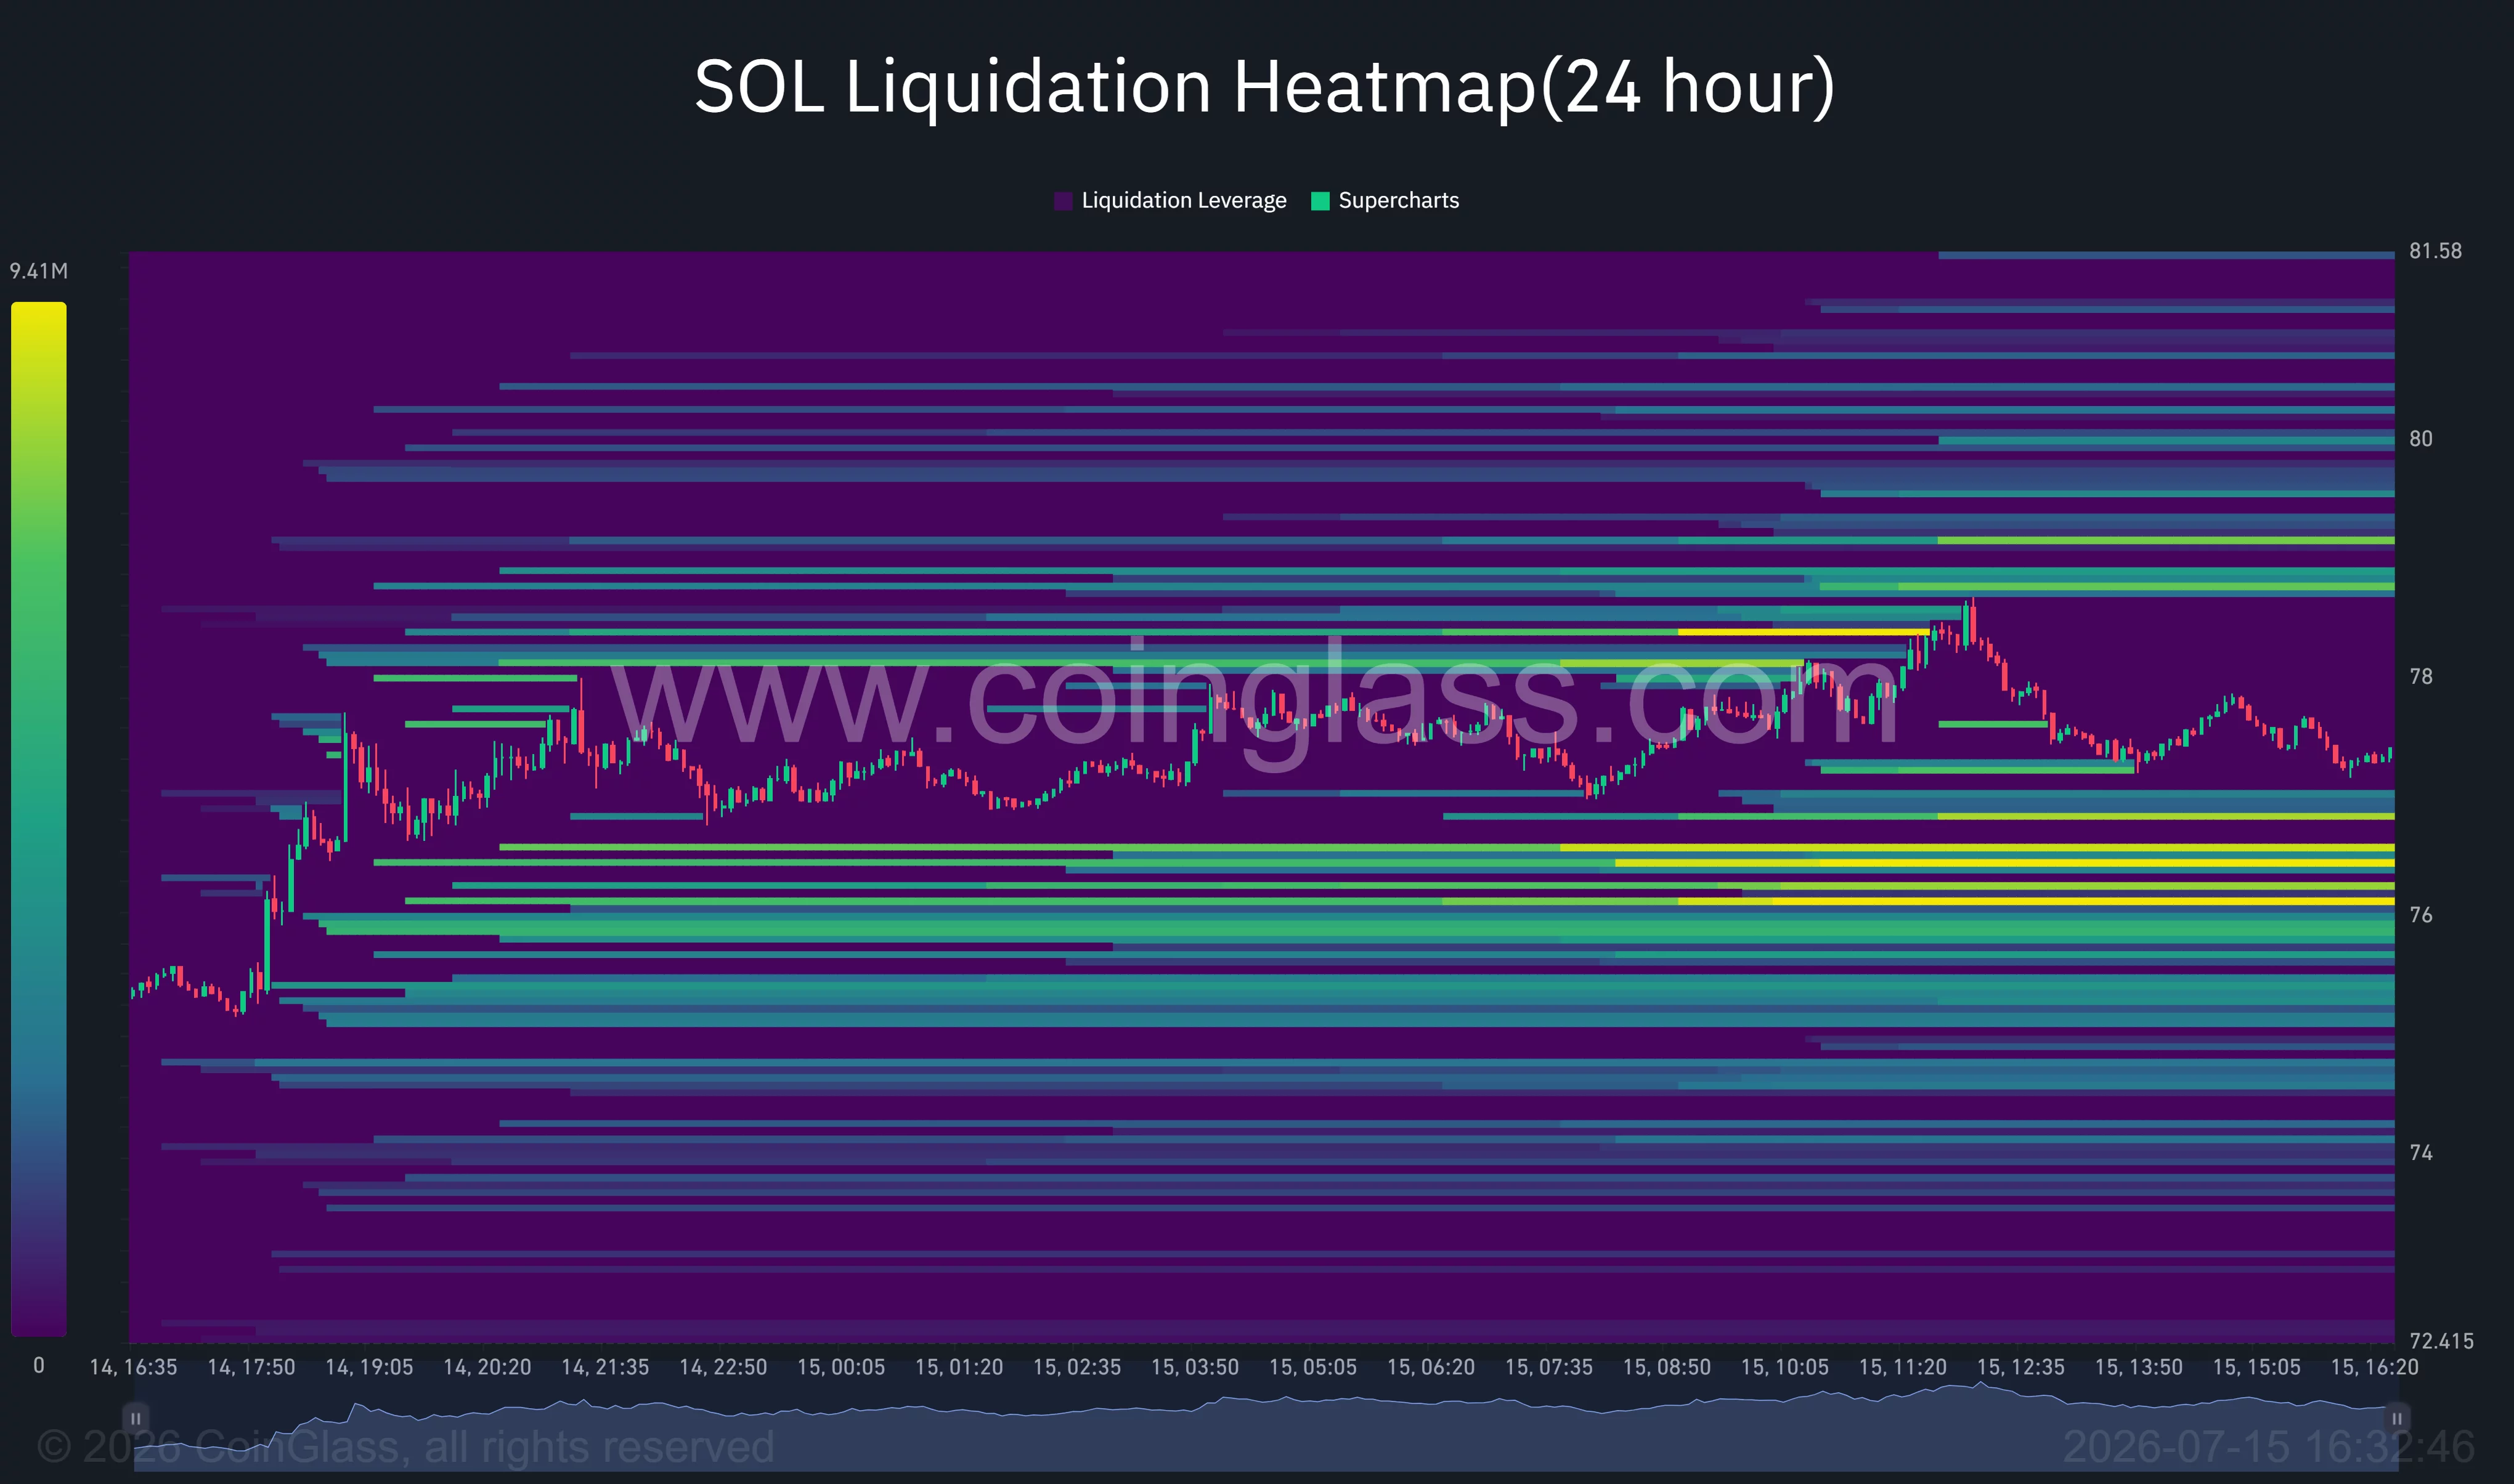
A decisive push through those levels could trigger forced buying from bearish positions, while the largest long liquidation pockets remain clustered around the $76-$76.5 region, making that zone an important area for bulls to defend.
Commenting on the latest setup, analyst Ali Martinez argued that Solana has regained a bullish structure after its SuperTrend indicator flipped positive for the first time since October. He wrote:
“If buying pressure continues to build, $SOL could rally toward $96 or even $121. However, $60 remains the key level to watch.”
Outside the charts, network fundamentals have also improved. Active addresses have climbed toward seven million, while anticipation continues to build ahead of the Alpenglow upgrade, which is expected to reduce transaction finality to around 150 milliseconds later this quarter.
Solana has also strengthened its institutional footprint through its partnership with SBI Holdings to expand on-chain financial infrastructure in Japan, while tokenized real-world assets on the network have grown to roughly $3.3 billion.
A break below key support would weaken the bullish outlook
Bullish momentum still faces several hurdles. The declining 100-day moving average around $80 represents the first major technical barrier, and failure to clear that level could keep SOL trapped inside its multi-week consolidation range.
A return below the 20-day and 50-day moving averages would shift attention back to the $75 support area, where leveraged long positions remain concentrated.
Macro risks also remain unresolved. Fresh geopolitical tensions, another rise in Treasury yields, or stronger-than-expected U.S. economic data could reduce expectations for monetary easing and pressure risk assets across the crypto market.
If selling accelerates and Solana loses the $70-$75 support zone, the bullish breakout thesis would weaken considerably, while Ali Martinez’s longer-term invalidation level near $60 would return to focus.
Disclosure: This article does not represent investment advice. The content and materials featured on this page are for educational purposes only.