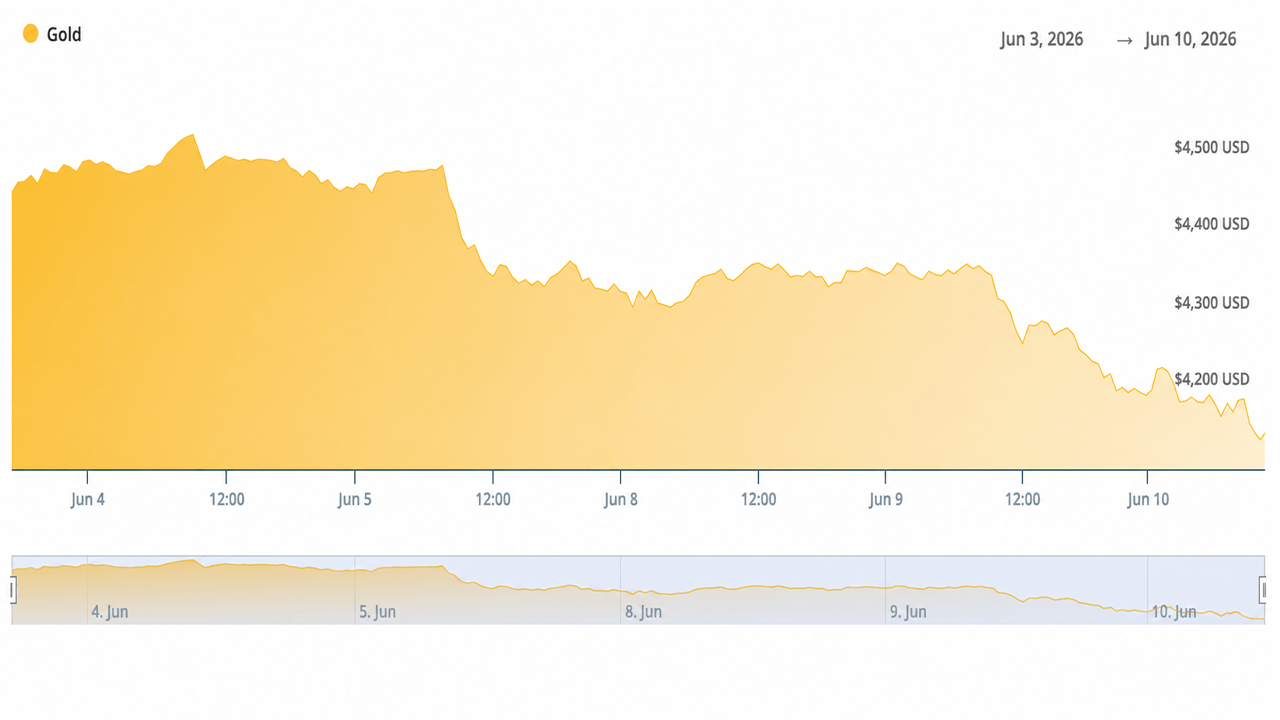
Traders Watch Gold Crash 3.25% to $4,120 After May CPI Confirms 4.2% Inflation
Key Takeaways
- Gold dropped $138.60 to $4,120 on June 10 as the Bureau of Labor Statistics (BLS) confirmed May CPI rose 4.2% year over year.
- CME FedWatch showed a 72% December rate-hike probability after the 172,000 May jobs report.
- Silver fell to $64.79, extending a 3-day loss from $67-plus as Iran escalation failed to lift metals.
Gold and Silver Prices on June 10
At 1:08 p.m. EDT, gold bid at $4,120.10 per ounce, down 3.25% on the day. The session low reached $4,106.20. Silver bid at $64.79, down 0.65%, with a daily low of $63.27. Platinum fell 2.03% to $1,687. Palladium was the lone gainer, up 0.25% to $1,217.
The moves extended a three-day selloff. Gold traded near $4,330 on June 8. By Wednesday afternoon, it had shed roughly $210 per ounce across the period.
What Drove the Selling
The Bureau of Labor Statistics released the May CPI report at 8:30 a.m. EDT on June 10. Headline inflation came in at +0.5% month over month and +4.2% year over year, up from 3.8% in April. Energy drove the majority of the monthly gain. Gasoline rose 7.0% in May and was up 40.5% year over year, accounting for more than 60% of the headline monthly increase. Core CPI held at +0.2% MoM and +2.9% YoY, with shelter adding another +0.3%.

Markets had already repriced Fed expectations following the May nonfarm payrolls report, which came in at 172,000, roughly double the 85,000 consensus estimate. CME FedWatch data showed December rate-hike odds at approximately 68–72% by June 10, up sharply from prior weeks. The 10-year Treasury yield rose to the 4.53–4.56% range. The U.S. Dollar Index firmed near 99.9.
Higher yields and a stronger dollar increase the opportunity cost of holding non-yielding assets like gold and silver. The CPI print confirmed what jobs data had already implied: monetary policy is unlikely to ease in the near term.
The Geopolitical Paradox
Israel-Iran missile exchanges and reported U.S. involvement near the Strait of Hormuz pushed oil toward $94–$96 per barrel at peak levels during the period. Normally, that type of geopolitical tension draws money into gold. Here, it did the opposite.
Higher oil prices fed directly into the energy component of CPI. Markets priced the inflation transmission channel, higher energy costs, hotter prints, hawkish Fed response, rather than the traditional uncertainty bid. The result: gold sold off even as the conflict escalated.

By June 9, reports of halted attacks and Trump-mediated de-escalation calls sent oil down roughly 3% to seven-week lows. That removed one layer of fear without removing the inflation pressure already embedded in the data. Gold continued lower.
Then on Tuesday evening, Trump’s statements escalated the matter as he reported that Iran had downed a U.S. military helicopter and that retaliation was necessary. On Wednesday, Trump insisted that Iran was “quickly becoming a failed nation” and he insists that “fake news media refuses to report how effective the U.S. Naval blockade is.”
Gold has not moved toward its alleged safe haven status during the last day, and it has, more or less, performed poorly during this specific conflict with Iran.
“Over $12.95 trillion has been wiped out from gold and silver in just 132 days,” the X account Bull Theory wrote on Wednesday. “ Gold has crashed -26.50% from its January peak, wiping out $9.75 TRILLION in market value. Silver is down -47.69%, wiping out $3.2 TRILLION. The craziest part is that this is happening while the Iran war is still active, oil is near $90, and inflation remains elevated, exactly the type of environment where gold and silver are supposed to outperform,” Bull Theory added.
Historical Context
Gold’s record during Middle East conflicts is not uniformly bullish. The 1990 Gulf War produced a 13% rally into the invasion, then a full reversal once the conflict was resolved quickly. The 2003 Iraq invasion followed a similar arc, a 20%-plus pre-war rally gave way to selling once ground operations began. The 2020 Soleimani strike briefly pushed gold above $1,550, then it faded within days.
The 1979 Iranian Revolution stands as the exception, where prolonged crisis combined with already-elevated inflation and dollar weakness produced a sustained rally from the mid-$200s to nearly $850 per ounce. That environment is structurally different from the current one.
The current pattern, strong jobs data, hot energy-driven CPI, rising yields, and dollar strength tracks the 1990, 2003, and 2020 playbook more closely than 1979. Nevertheless, gold is failing to live up to its long-held reputation as a safe-haven asset amid the current conflict in the Middle East.
Silver’s Deeper Drop
Silver fell more sharply than gold across the three-day window, consistent with its higher beta. The gold-silver ratio widened. Silver’s dual role as both a monetary and industrial metal means speculative long positioning unwinds faster during macro-driven risk-off episodes.

The metal had seen significant inflows during its run to an all-time high near $121 in early 2026. Profit-taking accelerated as macro conditions shifted.
Structural Backdrop
Central banks bought a net 244 tonnes of gold in the first quarter of 2026. Silver continues to face structural supply deficits tied to solar panel manufacturing, EVs, and electronics. Those longer-term fundamentals remain intact, but did not offset near-term selling pressure.
What Traders Are Watching Next
The BLS releases the May PPI on June 11. Any further geopolitical developments in the Iran-Israel conflict, Fed speakers, and physical demand data at current price levels will shape whether the $4,000 psychological level holds. A ceasefire or softer PPI print could support a relief rally. Persistent hot data or re-escalation risks further tests of support.