
Is the 4-Year Cycle Dead?
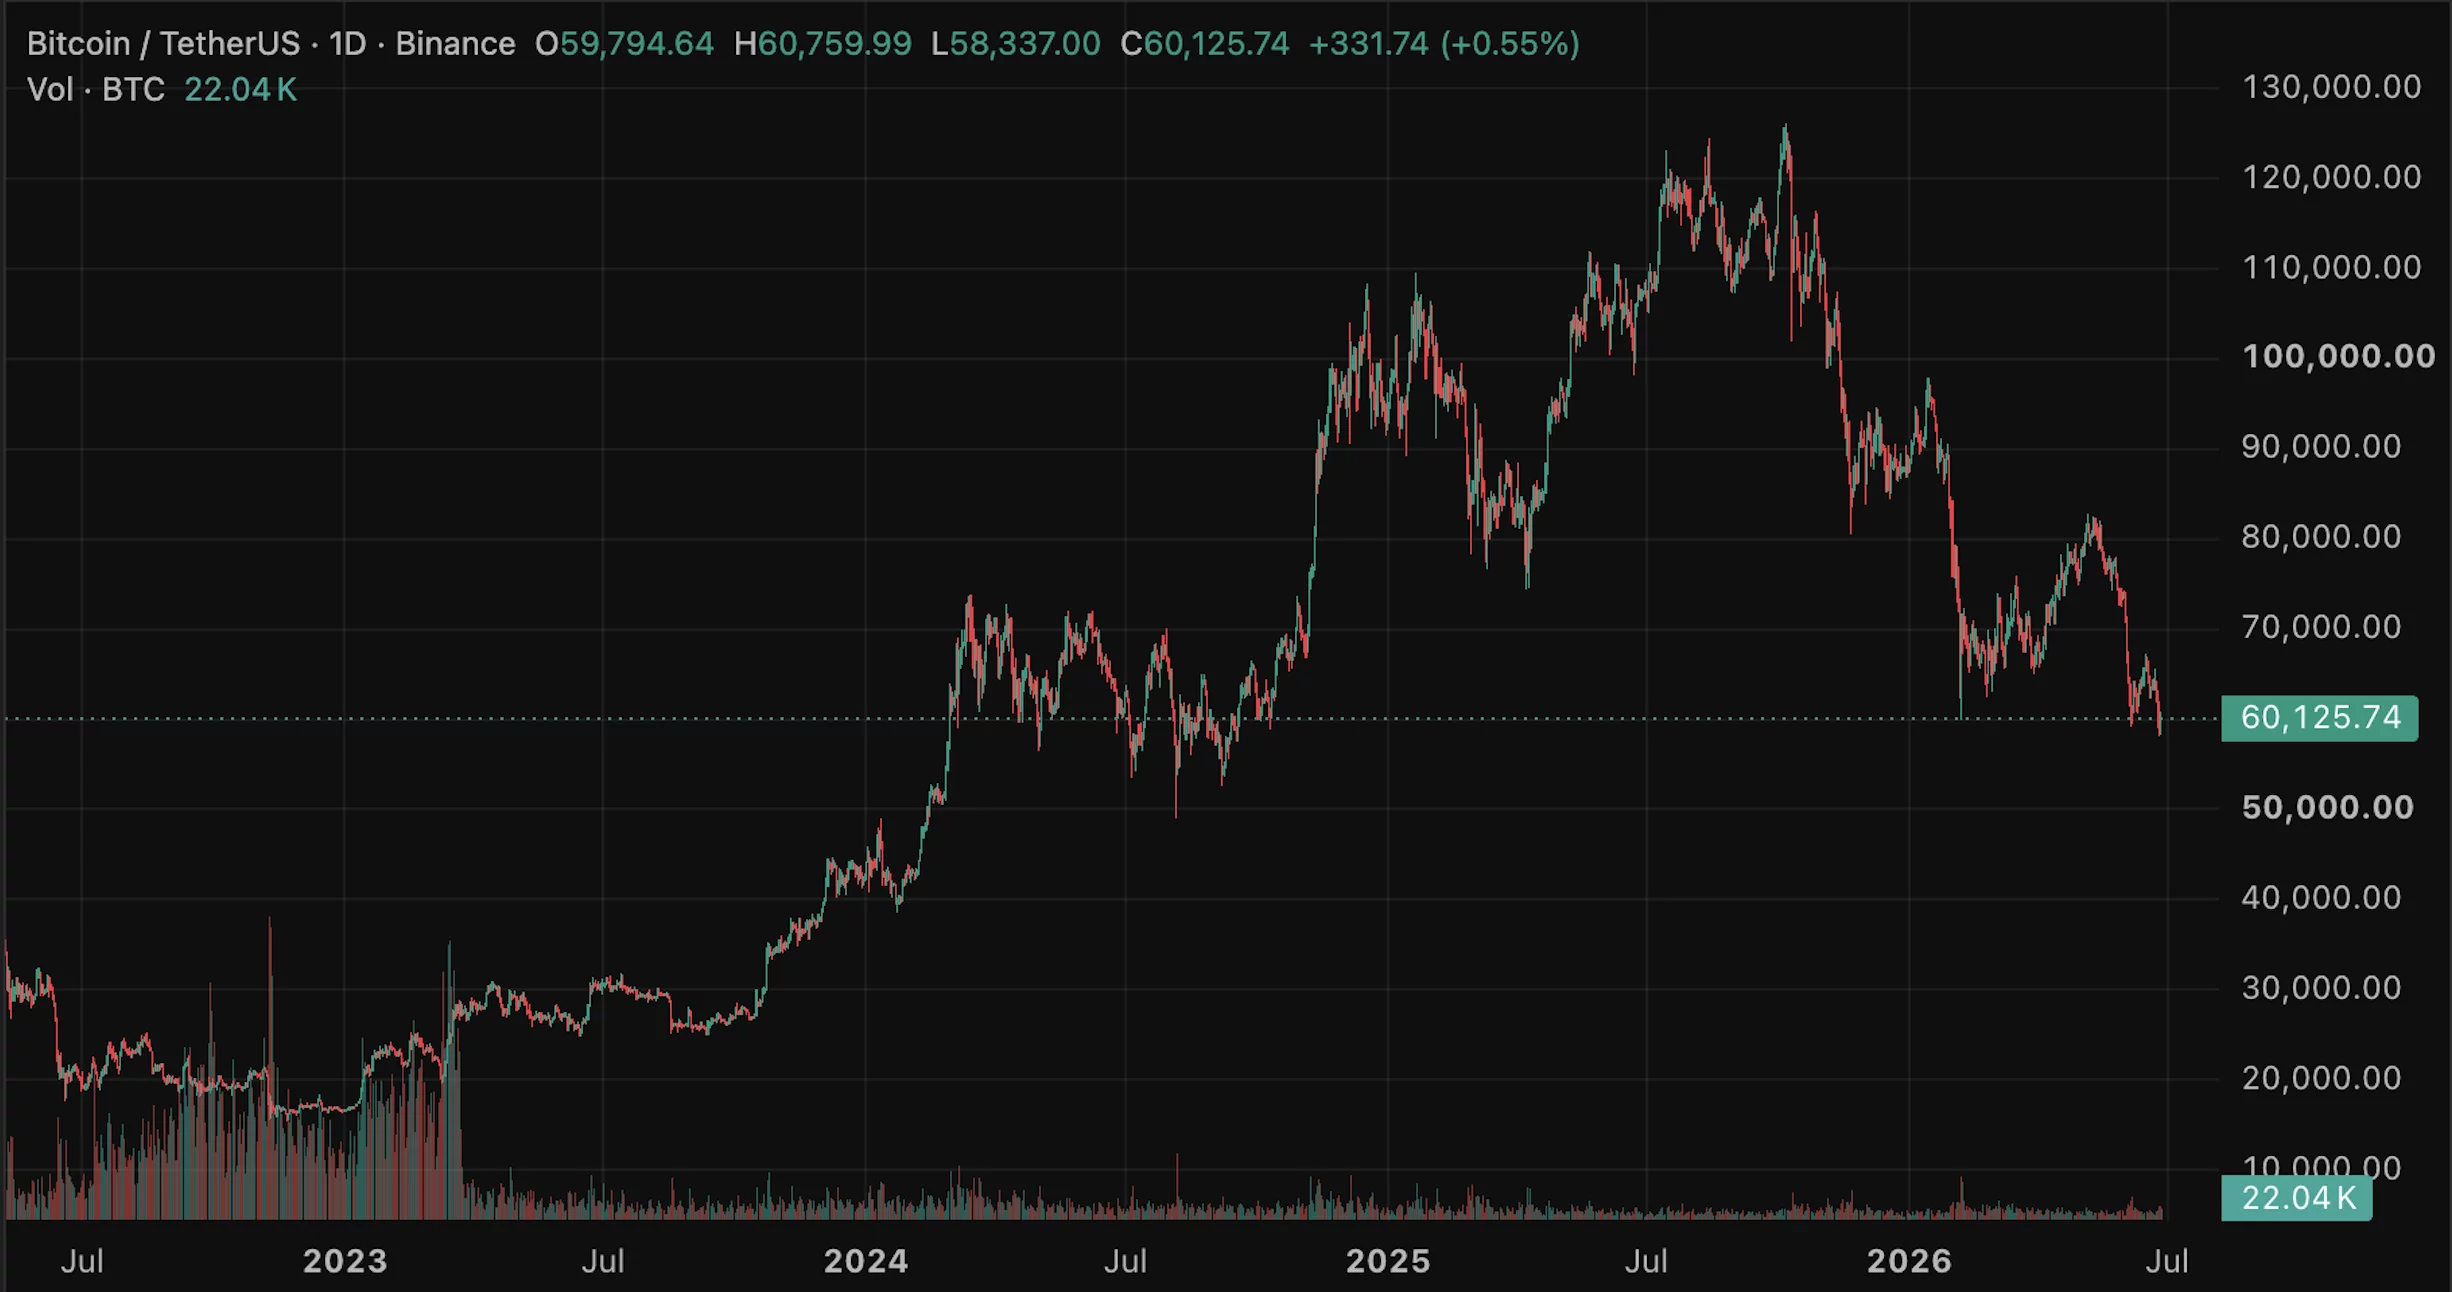
Bitcoin sits near $60,000, down more than half from its October peak, with traders in extreme fear and institutions pulling money out for six straight weeks. The single question that decides where it goes next is whether the famous four-year cycle still governs Bitcoin, or whether institutions have broken it for good.
Summary
- Bitcoin trades near $60,000, roughly 52% below its $126,000 October 2025 peak, sitting on its 200-week moving average with the Fear and Greed Index in extreme fear.
- The central debate is whether the four-year halving cycle is still in control, which would make this a textbook post-peak correction, or whether institutional demand has broken that cycle.
- The cycle-alive case fits the timing almost perfectly: Bitcoin peaked about 18 months after the 2024 halving and is now in the correction phase, the pattern predicts.
- The cycle-dead case argues that exchange-traded funds, corporate treasuries, and structural institutional demand have overridden the old retail-driven rhythm, pointing to a slow grind rather than a deep bear market.
- The crash is the test: a new low below the prior cycle bottom would vindicate the cycle, while holding here and grinding higher would suggest the pattern is broken. The outcome hinges on flows and the macro environment, not on any single price target.
Bitcoin is trading near $60,000, and depending on which framework you believe, that number is either the early stage of a painful but normal correction that ends with a familiar recovery, or the beginning of something the old playbook cannot explain.
The price is down roughly 52% from the all-time high near $126,000 set in October 2025. It is resting on a long-term technical line that traders watch closely. The sentiment gauge known as the Fear and Greed Index is buried in extreme fear, and institutions have pulled money out of Bitcoin exchange-traded funds for six consecutive weeks.
Every one of those facts can be read two ways, and the reading you choose depends almost entirely on a single question that now hangs over the entire market: is Bitcoin still governed by its famous four-year cycle, in which case this is the correction the cycle always brings, or have institutions broken that cycle, in which case the old rules no longer tell you what comes next.
This piece is built around that question, because it is the one that actually decides Bitcoin’s path through the rest of 2026, far more than any individual price level does.
The reason to frame a price prediction this way, rather than as a list of targets, is that the targets themselves flow from which thesis turns out to be right.
If the four-year cycle is alive, history points toward a deeper drawdown and a multi-quarter trough before the next halving-driven recovery. If the cycle is dead, the structural demand from funds and corporate treasuries could put a floor under the price well above where the old pattern would take it, turning a crash into a correction.
The honest work of a prediction, then, is not to pretend to know the number, but to lay out both frameworks clearly, weigh what the current evidence says about each, identify the levels and catalysts that would tip the balance, and translate all of it into concrete bull, bear, and base scenarios.
That is what follows: the cycle explained, the case for each side, what the crash is really signaling, the levels that matter, the scenarios, and the specific developments that would settle the debate.
Bitcoin at a crossroads
Start with where things actually stand, because the current picture is genuinely tense. Bitcoin fell hard through June, breaking down toward the $60,000 area in one of its worst stretches in months, with a single brutal session wiping out around $700 million in leveraged positions, the great majority of them bullish bets that were forced to close.
The drop brought Bitcoin to its 200-week moving average, a long-term trend line near $62,000 that has historically marked deep-cycle support, the kind of level that in past bear markets has roughly coincided with major bottoms.
Just below it, analysts flag the $59,000 area as the next test, and below that, the psychological $60,000 line gives way to genuine uncertainty about how far a breakdown could run.
The mood matches the chart. The Fear and Greed Index, which measures market sentiment on a scale from extreme fear to extreme greed, sits near the bottom of its range in extreme fear, a reading that reflects how thoroughly the recent decline has shaken confidence.
Institutional behavior tells a similarly cautious story, with spot Bitcoin exchange-traded funds posting six straight weeks of net outflows totaling close to $6 billion, described by analysts as the largest sustained institutional redemption wave since these funds launched.
Futures positioning has contracted sharply as traders cut leverage, a sign of de-risking rather than fresh conviction. And yet, woven through the gloom, are countervailing signals: a single day of positive fund flows late in the month, continued buying by corporate treasuries that view these levels as attractive, and the historical tendency of extreme fear to precede rebounds.
Bitcoin, in other words, is at a genuine crossroads, with the bearish evidence and the contrarian signals roughly balanced, and the cycle question is what tips the interpretation one way or the other.
The four-year cycle, explained
To weigh whether the cycle is alive or dead, you have to understand what the four-year cycle actually is, because it has been the dominant framework for understanding Bitcoin’s price for over a decade.
At the center of it sits the halving, a programmed event that occurs roughly every four years and cuts in half the rate at which new Bitcoin is created. Because Bitcoin’s supply growth slows abruptly at each halving while demand continues or grows, the halving has historically acted as a supply shock that, with a lag, drives the price upward.
The pattern that emerged across the first three cycles was remarkably consistent: in the 12-18 months following each halving, Bitcoin entered a powerful bull market and reached a new all-time high, after which it suffered a severe bear market, often falling seventy to 80% from the peak, before grinding through a recovery into the next halving and repeating the sequence.
This rhythm became almost a law in the minds of many investors. The halvings of 2012, 2016, and 2020 were each followed by a major price peak roughly a year to a year and a half later, and each peak was followed by a brutal drawdown and a multi-year trough.
The framework gave Bitcoin holders a kind of map: accumulate in the bear market, hold through the halving, ride the bull market to a new high, and brace for the crash that follows. The most recent halving occurred in April 2024, which places the present moment about 26 months into the current cycle, in what the framework would call the late-cycle or post-peak phase.
If the four-year cycle still governs Bitcoin, then the timing of the recent peak and the subsequent decline should look familiar, and the path ahead should rhyme with what happened after the previous three halvings. Whether it does is exactly what is now in dispute.
The case that the cycle is playing out exactly as it should
The argument that the four-year cycle is alive and well is, on the timing alone, strikingly persuasive. Bitcoin reached its all-time high near $126,000 in October 2025, which is roughly 18 months after the April 2024 halving, landing squarely inside the 12-18-month window in which the previous three cycles each topped out.
From the cycle’s perspective, that peak was the natural climax of the post-halving bull market, right on schedule. What has followed, a sharp decline that has now erased more than half the price, is precisely the kind of post-peak correction the pattern predicts, the opening phase of the bear market that historically arrives after each cycle high.
Seen this way, nothing about the current crash is surprising or anomalous; it is the cycle doing exactly what it has always done.
Respected voices in traditional finance hold this view. Some analysts have described 2026 as a likely correction year, the down phase of the cycle, pointing to support zones in the $60,000-$75,000 range as the kind of levels a cycle correction might test or breach.
Prominent cycle analysts have argued that the cycle bottom still lies ahead, with base cases placing a potential new low later in 2026, consistent with the historical pattern in which the trough comes well after the peak.
Under this framework, the extreme fear, the institutional outflows, and the technical breakdown are all expected features of the post-peak phase, not signs that something unprecedented is happening.
The cycle-alive case, therefore, implies real further downside: if Bitcoin follows the template of prior cycles, the current decline could deepen toward a trough materially below current levels before the next halving-driven recovery begins. It is a sobering view, but it has history and timing firmly on its side, which is what makes it so hard to dismiss.
The case that the cycle is dead
The opposing argument is that the four-year cycle was a feature of a Bitcoin market that no longer exists, and that the forces which created the cycle have been overwhelmed by something new.
The cycle, in this view, was largely a product of retail-driven speculation amplified by the halving narrative, a self-fulfilling rhythm that worked when Bitcoin was a small, speculative asset, moved mainly by individual traders and the four-year supply story.
What has changed is the arrival of institutions at scale. Spot exchange-traded funds have brought enormous, structural pools of capital into Bitcoin, corporate treasuries have adopted it as a reserve asset and accumulate it continuously, and large financial institutions now treat it as a portfolio allocation instead of a speculative flyer.
These holders do not buy and sell on the halving narrative; they respond to macro conditions, portfolio strategy, and long-term conviction, and their presence changes the market’s fundamental behavior.
Proponents of this view, including some prominent research shops, argue that Bitcoin has entered a slow bull phase more akin to a mature asset like gold than to its old boom-and-bust cycles, in which persistent institutional demand smooths out the violent four-year swings and replaces them with a steadier, longer grind higher.
In this framework, the halving still matters as a supply event, but it no longer dictates the price the way it once did, because the marginal buyer is now an institution instead of a retail speculator chasing the cycle.
The implication is that the deep, 70-80% bear markets of the past may not repeat, because structural demand provides a floor that did not exist before, turning what would once have been a cycle-ending crash into a more contained correction.
If this thesis is right, then the current decline, however painful, is a drawdown within an ongoing structural bull market instead of the start of a multi-year winter, and the $60,000 area could prove closer to a bottom than to a way station on the road down. The cycle-dead case, in short, says the old map no longer describes the territory.
What the crash is actually telling us
The natural question is whether the current crash settles the debate, and the honest answer is that it does not, because the evidence cuts both ways, which is itself revealing.
On the bearish side, the six straight weeks of exchange-traded fund outflows, totaling close to $6 billion, complicate the cycle-dead thesis, because they show that institutional demand, far from providing an unshakable floor, can reverse hard and become a source of selling pressure.
The slow-bull argument rests on institutions being steady, structural buyers, and a sustained redemption wave of this size shows that institutional money can flee risk just as retail money does, dragging the price down instead of cushioning it.
The extreme fear, the forced liquidations, and the breakdown to long-term support all fit comfortably within the cycle-alive interpretation of a post-peak correction gathering momentum.
On the other side, several signals support the cycle-dead reading. Even amid the outflows, corporate treasuries kept buying through the decline, with major holders adding to their positions at current levels and explicitly framing them as attractive entry points, behavior that reflects exactly the structural, conviction-driven demand the slow-bull thesis describes.
Late in the month, fund flows turned positive for a day, a tentative hint that the institutional selling may be exhausting itself. And the very depth of the extreme-fear reading, historically, has often preceded rebounds instead of further collapse, because it tends to mark the point of maximum pessimism where selling pressure runs out.
The takeaway is that the crash is genuinely ambiguous: it has features that fit both frameworks, and it has not yet produced the one piece of evidence that would be decisive, which is whether Bitcoin makes a new cycle low or holds here and recovers. Until that resolves, the data refuses to declare a winner, which is precisely why the cycle question remains open and why the next few months matter so much.
The levels that matter
While the big-picture debate plays out, the technical levels provide the concrete map traders are watching, and they are worth knowing because they will mark, in real time, which thesis is gaining the upper hand.
The most important support is the 200-week moving average near $62,000, the long-term trend line that has historically tracked deep-cycle bottoms; a decisive, sustained break below it would be a meaningful signal that the bearish, cycle-alive scenario is taking hold, because losing that level has in the past preceded extended declines.
Just beneath sit the $59,000 area and the round $60,000 psychological level, the latter being the line that prediction-market traders have heavily wagered Bitcoin will break to set a new yearly low, with a smaller but real probability assigned to a fall under $50,000.
On the upside, the levels that would suggest the decline is stabilizing run through the $64,000-$65,000 zone as immediate resistance, with the broader trading range capped near $66,000-$67,000. Reclaiming those levels with conviction would weaken the bearish case and lend support to the idea that structural demand is putting in a floor, while repeated rejection there would keep sellers in control.
The key point is that these levels are not just numbers but markers in the larger argument: holding the 200-week moving average and pushing back above resistance would be evidence for the cycle-dead, floor-is-holding thesis, whereas breaking down through support toward the fifties would be evidence for the cycle-alive, correction-deepening thesis.
The chart, in this sense, is where the abstract debate becomes concrete, and the next decisive move through one of these levels will tell observers a great deal about which framework is winning.
The bull, base, and bear cases for 2026
Translating all of this into scenarios means tying each outcome to the cycle question and to the levels and flows that would drive it. These are conditional ranges, not predictions, and each depends on which forces win out.
- Bull case: Bitcoin holds the 200-week moving average, the extreme fear marks a local bottom, institutional fund flows turn decisively positive, and a friendlier macro backdrop, such as signals of easier monetary policy, restores risk appetite. In this scenario, the cycle-dead, structural-demand thesis is vindicated, the $60,000 area proves to be a correction low, and Bitcoin recovers back toward and through its prior resistance, with more optimistic institutional targets pointing well into six figures over the following year as the slow bull resumes.
- Base case: the tension persists and Bitcoin chops within a wide range for an extended period, neither breaking down to a new cycle low nor mounting a clean recovery, as steady treasury buying offsets continued fund outflows and the market waits for macro clarity. In this scenario, the cycle question stays unresolved, Bitcoin grinds sideways to modestly lower around current levels, and direction depends on which flow trend wins out over the second half of the year.
- Bear case: Bitcoin loses the 200-week moving average decisively, the institutional outflows continue, and the four-year cycle reasserts itself in textbook fashion, driving a deeper correction toward the $50,000 area or below as the post-peak bear market plays out. In this scenario, the cycle-alive thesis wins, prediction-market bets on a sub-$50,000 print are realized, and Bitcoin works toward a cycle trough later in the year before any halving-driven recovery can begin.
What would settle the debate
For anyone trying to read Bitcoin’s direction over the coming months, the analysis points to a short list of developments that would actually settle the cycle question, and watching them is more useful than fixating on any single price. The first and most decisive is simply whether Bitcoin makes a new cycle low. If it breaks down through the 200-week moving average and the $60,000 area toward a materially lower trough, the four-year cycle will have shown that it still governs the market, and the bearish framework will have won.
If, instead, Bitcoin holds these levels and begins to recover, the case that structural demand has broken the cycle gains powerful support. That single binary, new low, or held floor, is the cleanest test available.
The second thing to watch is the institutional flow trend. The six-week outflow streak is the strongest evidence against the slow-bull thesis, so a durable reversal back to sustained net inflows would suggest the structural demand is reasserting itself, while a continuation or acceleration of outflows would reinforce the bearish, cycle-alive reading.
The behavior of corporate treasuries matters here too: continued accumulation through weakness supports the floor thesis, while any sign of treasuries slowing or reversing would be a serious warning.
The third factor is the macro environment, since Bitcoin now trades heavily as a risk asset, and a shift toward easier monetary policy or renewed risk appetite would support the bullish case, while tighter conditions and risk aversion would deepen the decline.
The honest conclusion is that Bitcoin’s path through 2026 is not yet written, because it depends on a genuine, unresolved question about whether the oldest pattern in crypto still holds. The cycle is either running late or it is dead, and the market is about to find out which, with the 200-week moving average, the flow data, and the macro backdrop serving as the scoreboard. Until those resolve, humility about any specific target is not weakness but accuracy.
Frequently Asked Questions
What is the four-year Bitcoin cycle?
It is the dominant framework for understanding Bitcoin’s price, built around the halving, a programmed event roughly every four years that cuts the rate of new Bitcoin creation in half. Historically, in the 12-18 months after each halving, Bitcoin entered a bull market and reached a new all-time high, then suffered a severe bear market, often falling 70-80%, before recovering into the next halving. The pattern held across the 2012, 2016, and 2020 halvings, giving investors a map of accumulation, bull run, peak, and crash that has shaped how the market thinks about Bitcoin for over a decade.
Where is Bitcoin in the cycle right now?
The most recent halving was in April 2024, which places the present moment about 26 months into the current cycle, in what the framework calls the late-cycle or post-peak phase. Bitcoin reached its all-time high near $126,000 in October 2025, roughly 18 months after the halving, squarely within the historical window for a cycle peak. The decline since then, now more than 50%, would be the post-peak correction the cycle predicts. If the cycle still governs, the trough would typically come well after the peak, potentially later in 2026.
Why do some analysts think the cycle is dead?
Because the market that created the cycle has changed. The four-year rhythm was largely driven by retail speculation amplified by the halving narrative, when Bitcoin was a small asset moved by individual traders. Now spot exchange-traded funds, corporate treasuries, and large institutions have brought structural capital that responds to macro conditions and portfolio strategy instead of the halving story. Proponents argue this has turned Bitcoin into a slow-bull asset more like gold, with steadier demand smoothing the violent four-year swings and providing a floor that could prevent the deep bear markets of the past from repeating.
What does the current crash tell us about the debate?
It does not resolve it, because the evidence cuts both ways. The six straight weeks of fund outflows show institutional demand can reverse and become selling pressure, undercutting the steady-floor thesis and fitting the cycle-alive correction view. But corporate treasuries kept buying through the decline, fund flows turned positive for a day, and extreme fear has historically preceded rebounds, all of which support the cycle-dead reading. The decisive evidence, whether Bitcoin makes a new cycle low or holds and recovers, has not yet arrived, which is why the debate remains open and the coming months are pivotal.
What price levels matter most?
The key support is the two-hundred-week moving average near $62,000, a long-term line historically tied to deep-cycle bottoms; a decisive break below it would signal the bearish scenario is taking hold. Beneath sit the $59,000 area and the $60,000 psychological level, with prediction markets heavily wagering on a break to new yearly lows and a smaller chance of a fall under $50,000. On the upside, 64,000-$65,000 is immediate resistance, with the range capped near $66,000-$67,000. Holding support and reclaiming resistance favors the bulls; breaking down favors the bears.
Could Bitcoin fall below $50,000?
It is possible, and prediction-market traders assign a real probability to it. In the bearish, cycle-alive scenario, Bitcoin loses its 200-week moving average, institutional outflows continue, and the post-peak bear market drives a deeper correction toward 50,000 or below as the cycle works toward a trough later in the year. This is not a certainty, and the bullish scenario, in which structural demand puts in a floor near current levels, is equally coherent. Which path unfolds depends on the cycle question, the flow data, and the macro environment, none of which has yet been settled, so a fall below $50,000 is a genuine risk instead of a forecast.
This article is information, not investment advice. The scenarios described are conditional ranges that depend on unresolved questions, not predictions, and Bitcoin is highly volatile. Prices, flows, and sentiment reflect reporting available as of June 26, 2026, and can change quickly. Nothing here is a recommendation to buy or sell. Verify current data from primary sources and consider your own circumstances before making any decision.