ETH Hits a Decision Point as Major Resistance Comes Into Play
After staging an impressive rebound from its local bottom, Ethereum is beginning to test increasingly important resistance levels. The coming sessions should provide more clarity on whether this recovery has enough momentum to continue.
Ethereum Price Analysis: The Daily Chart
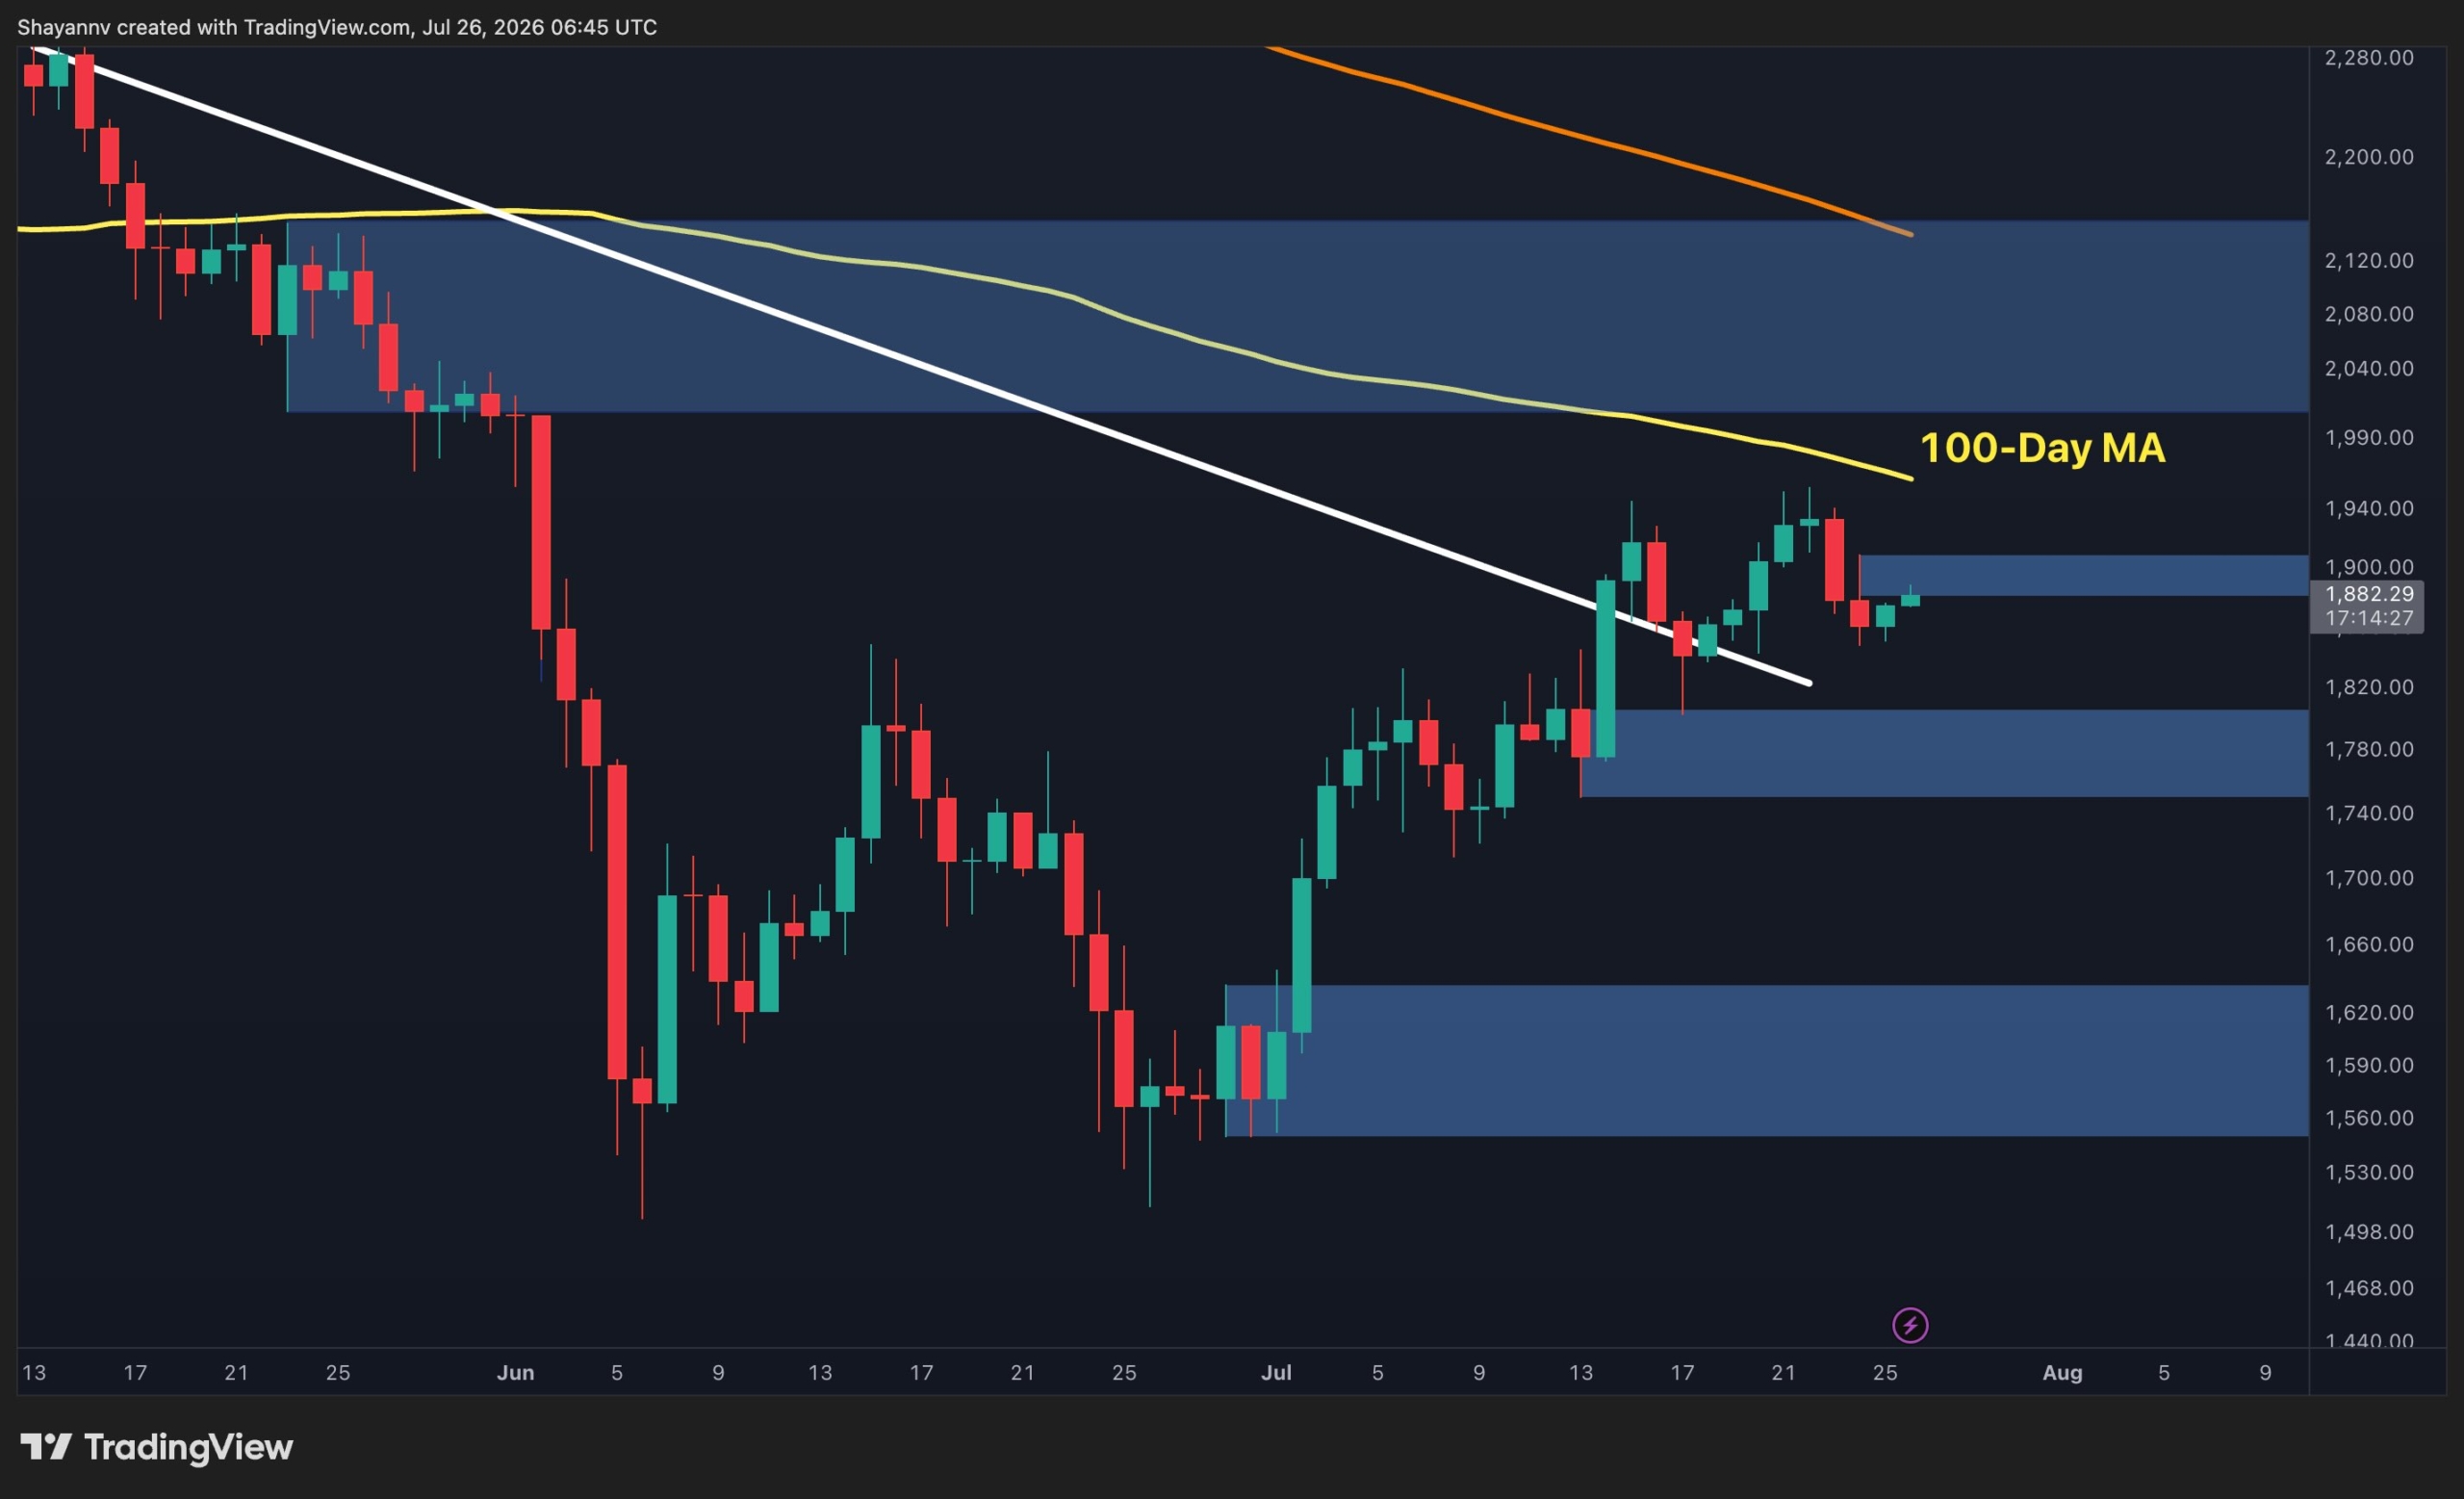
The daily chart shows ETH holding above the previously broken descending trendline, confirming that the medium-term structure has improved compared to the aggressive selloff seen in June. Following the breakout, the market has successfully established a sequence of higher highs and higher lows while consolidating above the $1.76K to $1.82K support region.
However, the recovery is now approaching a major technical barrier. The $1.88K to $1.91K supply zone is acting as the first resistance, while the declining 100-day moving average sits just overhead near the $1.95K area. This creates a confluence of resistance that could cap the current rally before ETH attempts to challenge the broader long-term supply zone between roughly $2K and $2.15K.
As long as the price remains above the $1.76K to $1.82K support, buyers maintain the short-term advantage. Losing that area, however, would expose the next support around $1.55K to $1.64K and weaken the current bullish structure.
ETH/USDT 4-Hour Chart
On the 4-hour timeframe, Ethereum has slipped slightly below the ascending trendline that had guided the recovery throughout July. While the break is not yet decisive, it signals that bullish momentum is beginning to weaken as the price trades inside the $1.88K to $1.91K supply zone. The current structure suggests that buyers are losing some control after failing to extend the recent rally.
If ETH remains below the broken trendline, the move could evolve into a deeper retracement toward the notable demand zone around $1.76K to $1.79K, where buyers would be expected to step in. Conversely, reclaiming the trendline and securing a breakout above the $1.88K to $1.91K resistance would invalidate the short-term weakness and increase the probability of another push toward the $1.95K to $2K region.

Sentiment Analysis
The one-month Binance ETH liquidation heatmap shows a substantial concentration of liquidity around the $1.5K level. Although Ethereum is currently trading well above that region, this cluster remains an important magnet from a derivatives perspective.
If the current rally loses momentum and sellers regain control, a deeper correction toward the $1.5K liquidity pocket could attract price as leveraged long positions are unwound.
Such a move would likely coincide with a break below the key technical supports visible on the chart. Until then, the prevailing structure remains constructive, but the presence of this large liquidity cluster highlights that downside risk has not completely disappeared despite the recent recovery.

LIMITED OFFER for CryptoPotato readers at Bybit: Use this link to register and open a $500 FREE position on any coin!
Disclaimer: Information found on CryptoPotato is those of writers quoted. It does not represent the opinions of CryptoPotato on whether to buy, sell, or hold any investments. You are advised to conduct your own research before making any investment decisions. Use provided information at your own risk. See Disclaimer for more information.