Bitcoin News: $1Bn ETF Exodus and What it Means for BTC USD
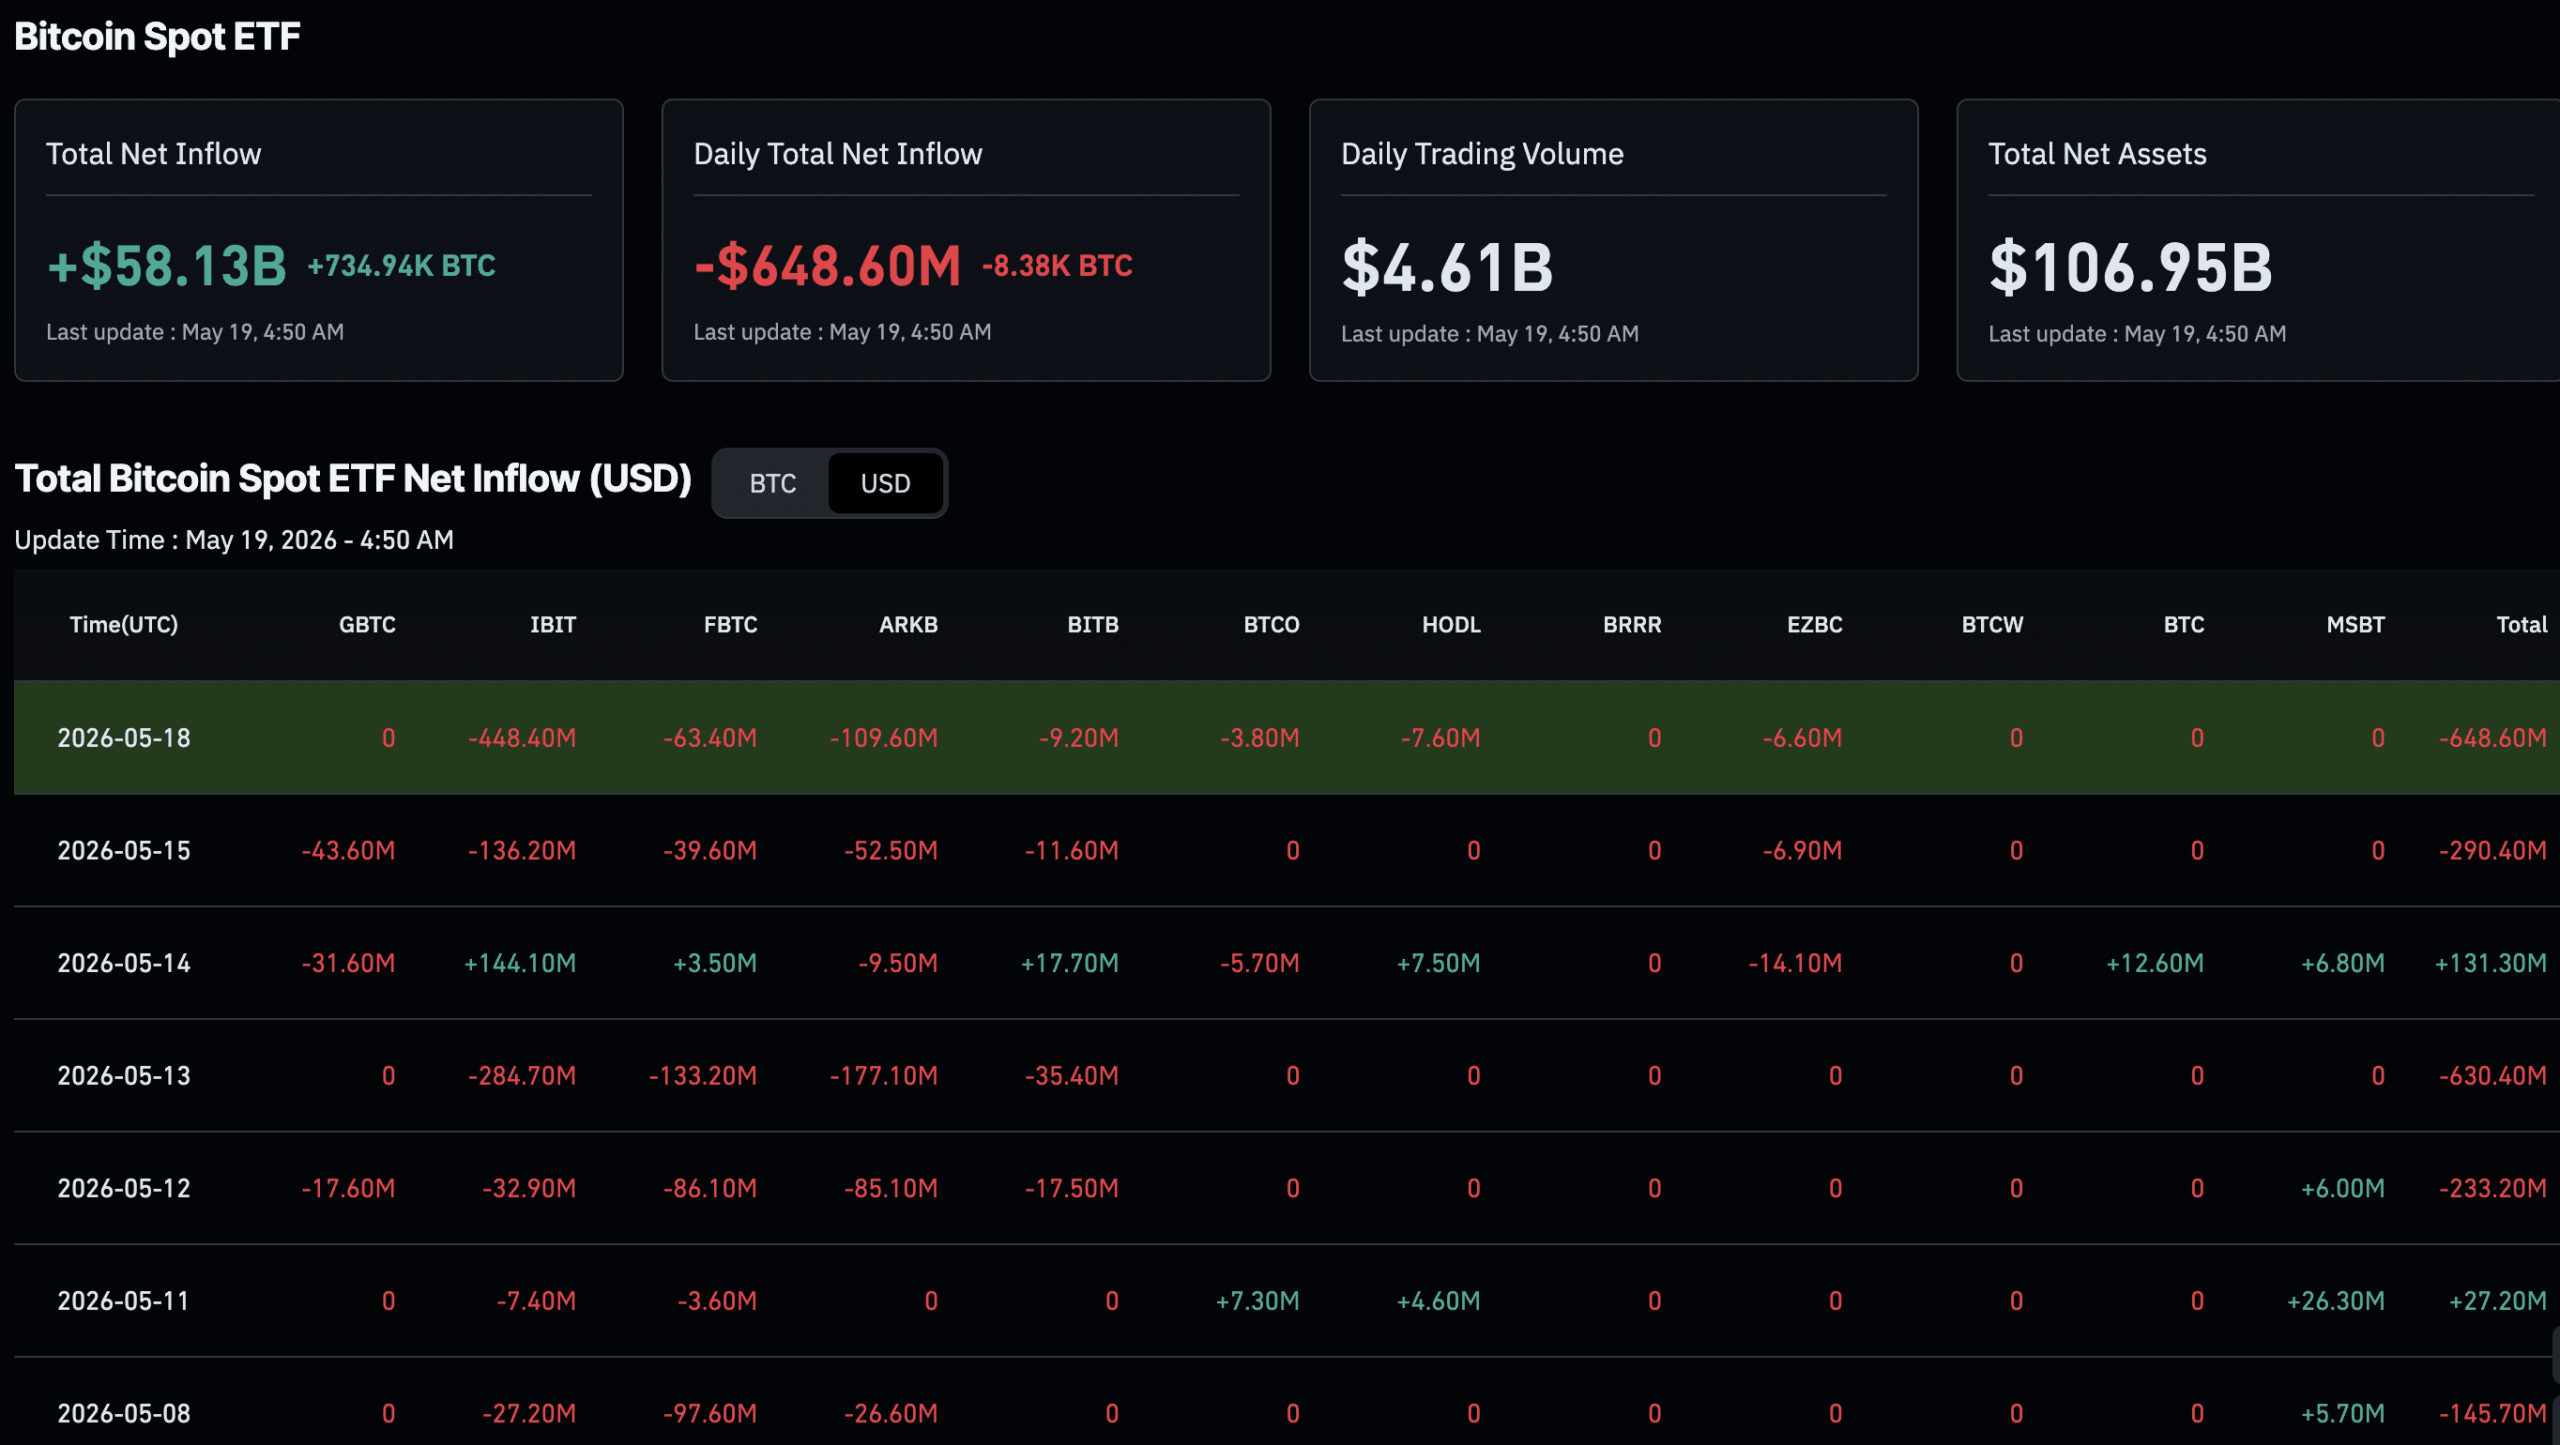
In Bitcoin news today, US spot Bitcoin ETFs recorded $648.64M in net outflows on May 18, 2026, one of the largest single-day redemptions of the year, as Bitcoin shed roughly $6,000 from its mid-May highs, erasing more than $126Bn in market capitalization.
The trigger was a milestone in Washington: the CLARITY Act advancing to a full Senate vote, a development most analysts considered a long-term positive for crypto. However, the market’s immediate response was to sell.
Here is the central tension this article unpacks: if the CLARITY Act is good news for Bitcoin, why did it cause a BTC price crash and institutional flight from ETFs? And more importantly, does that selling actually threaten your portfolio, or is it the kind of noise that looks scary and means very little over a twelve-month horizon?
This sizeable daily ETF outflow comes as Bitcoin USD dropped -0.5% overnight, falling from around $77,800 to just above $77,000. Daily BTC trading volume also took a nosedive, processing around $40.1Bn, down from $58Bn the previous day.
My Next $BTC Plan:
It’s starting to look like this rally has come to an end.
Although I’m still in my short trades, I’m planning on opening a long scalp when price retests the grey box.
This box aligns with the macro uptrend, the range highs, the golden pocket, and the aVWAP.… pic.twitter.com/mOE9WwcaNC
— CGT Trader (@CGT_Trader) May 19, 2026
Bitcoin News: ETF Outflows and What the $648M Number Means for BTC
When institutions invest in funds, the asset manager buys BTC to back those shares. When they redeem shares, the fund sells BTC. So heavy outflows create direct, mechanical selling pressure on the spot market – which is exactly what moved the price last week.
On May 18 alone, BlackRock’s iShares Bitcoin Trust (IBIT) accounted for $448M of those outflows, its second-largest single-day redemption of 2026, per CoinGlass data. Fidelity’s FBTC and ARK’s ARKB also posted notable red figures. This came on the heels of roughly $1 billion in net outflows during the prior week (May 11–15), snapping a six-week inflow streak.
The number that reframes the headline: year-to-date ETF inflows still sit above $65Bn across the largest funds. The $648M single-day outflow represents less than 1% of that cumulative base. A similar outflow event earlier this year offered the same lesson: the scary daily number looks very different when placed against the structural picture.

DISCOVER: 99Bitcoin’s Readers – Earn $10 USDC When You Sign Up for Binance
Institutional Profit-Taking After a Historic Rally: Normal or Alarming?
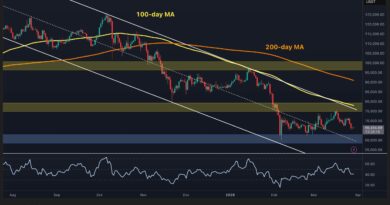
Bitcoin cleared $80,000 on May 4, 2026, tested the 200-day moving average near $82,000, and looked headed toward the $85,000–$87,000 target range analysts had been flagging since April’s record $2.44Bn in ETF inflows. Then the CLARITY Act headline dropped, and traders executed what BullTheory, a widely-followed account on X, called a “textbook SELL THE NEWS bloodbath.”
The pattern is well-documented. Investors accumulate ahead of an anticipated catalyst, in this case, landmark crypto regulation 2026 observers had been tracking for months. Once the news arrives, the position is closed. The catalyst becomes the exit, not the entry. Ethereum fell more than 10% in the same window, erasing $30Bn in market cap, suggesting this was broad profit-taking rather than a Bitcoin-specific crisis.
Bloomberg ETF analyst Eric Balchunas noted that, even amid 2026’s redemption periods, “the overarching trend continues to be historically favorable” and that spot BTC ETFs have “substantially exceeded initial market forecasts” for inflows, per Yahoo Finance reporting.
That mirrors the institutional behavior seen when Jane Street trimmed its IBIT position earlier this year, rotation, not retreat. The key variable is whether outflows extend into multiple consecutive weeks or reverse quickly, as they did in late February when ETFs absorbed $1.1Bn in three days.
Bitcoin Price Outlook: Three Scenarios Worth Watching
In other Bitcoin news, at the time of writing, Bitcoin is trading near $77,000, sitting just above the $76,700 support zone. The 20 EMA has flipped to resistance near $72,200, and MACD is deeply negative on the hourly chart. Here is how the next few weeks likely play out:
- Bull case: ETF flows reverse to net positive within the next five trading days, Bitcoin holds the $76,800 support level, and the CLARITY Act’s Senate progress is reframed as a structural tailwind. Price is expected to recover toward $82,000–$85,000 by the end of May.
- Base case: Outflows slow but don’t reverse immediately. Bitcoin consolidates between $75,000 and $79,000 for one to two weeks as the market digests both the regulatory news and the leverage flush. A gradual recovery follows once Senate proceedings provide more clarity.
- Bear/invalidation case: Outflows persist for more than 2 weeks, macro conditions deteriorate, and Bitcoin breaks below the $76,300 support zone. A test of the $69,000–$72,000 range becomes the likely next stop, invalidating the near-term bullish thesis entirely.
The single most useful data point to track right now is daily ETF flow figures from CoinGlass or SoSoValue. Two consecutive sessions of accelerating outflows near current price levels would be a meaningful warning that this is more than a sell-the-news flush.
EXPLORE: Best Crypto Presales Gaining Traction Right Now
Follow 99Bitcoins on X, YouTube, and Telegram for more crypto news and analysis.
The post Bitcoin News: $1Bn ETF Exodus and What it Means for BTC USD appeared first on 99Bitcoins.