
Bitcoin Closes In On $90,000—Here’s How The On-Chain Path Ahead Looks

The market intelligence platform IntoTheBlock has revealed how the Bitcoin resistance ahead is currently looking, based on on-chain data.
Bitcoin Could Have An Easier Time Past $90,000 In Terms Of Resistance
In a new post on X, the market intelligence platform IntoTheBlock has talked about how the on-chain cost basis map is looking for Bitcoin. Below is the chart shared by the analytics firm, showing the trend in the amount of supply that was acquired in the different price ranges BTC has been to.
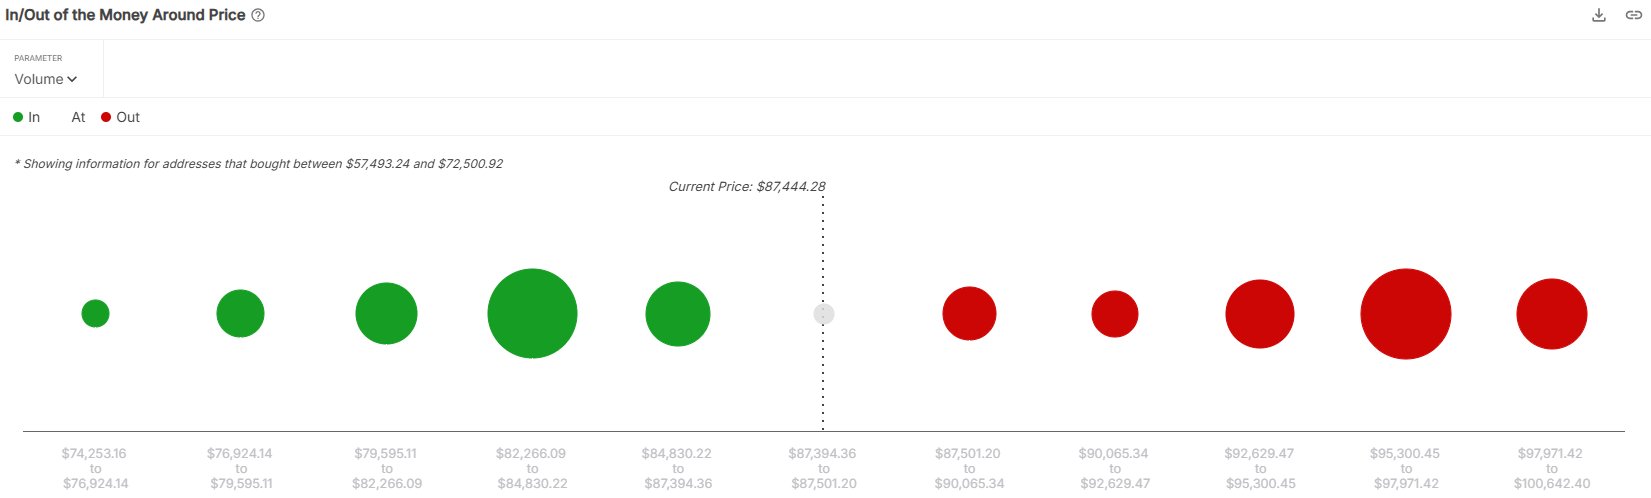
Looks like BTC doesn't have any large dots immediately ahead of it at the moment | Source: IntoTheBlock on X
In the graph, the size of the dot corresponds to the amount of supply that the investors last bought inside the associated Bitcoin price range. From the ranges listed in the chart, two in particular stand out for the scale of their supply: $82,266 to $84,830 and $95,300 to $97,971.
The former is under the current spot price, meaning that the owners of those coins would be sitting on some profit right now. Similarly, that of the latter’s would be underwater.
To any investor, their cost basis is an important level, so whenever a retest of it takes place, they may be likely to show some kind of reaction. Naturally, when Bitcoin retests a level that has the acquisition mark of only a few investors, there wouldn’t be any reaction large enough to cause fluctuations in the price.
In the case where a large amount of holders do share their cost basis inside a narrow range, however, a sizeable reaction may appear. As for the nature of the reaction, it comes down to the direction of the retest and the overall mood among the investors.
When the retest occurs from above (that is, the holders were in the green prior to it), the investors may decide to buy more, believing the same level would be profitable again in the future. This is, of course, if the holders still carry a bullish sentiment.
Similarly, investors who were in loss prior to the retest may decide to sell when it takes place, as they could fear the cryptocurrency would fall again in the near future.
Given these effects, large cost basis centers under the Bitcoin spot price can act as support cushions, while those above may prove to be resistance walls. As it is right now, the coin is heading toward two ranges with little supply contained in them: $87,501 to $90,065 and $90,065 to $92,629.
It’s possible that the asset may slip through them with relative ease, should bullish momentum continue. The $92,629 to $95,300 range after these two is moderately sized, but still not too big. So the next major real obstacle will be the aforementioned $95,300 to $97,971 range.
BTC Price
Bitcoin has seen a reignition of its recovery rally in the past day as its price has climbed back to $86,900.
The price of the coin seems to have shot up during the last 24 hours | Source: BTCUSDT on TradingView
Featured image from Dall-E, IntoTheBlock.com, chart from TradingView.com
Editorial Process for bitcoinist is centered on delivering thoroughly researched, accurate, and unbiased content. We uphold strict sourcing standards, and each page undergoes diligent review by our team of top technology experts and seasoned editors. This process ensures the integrity, relevance, and value of our content for our readers.